Power BI Service
Power BI Service (PBS) is the online platform of Power BI. Although it has a lot of features that enables to do work directly in the service, it is effectively designed to be an extension of the PBI desktop. PBI Desktop’s data transform and load capabilities allow the design and modelling of data for analysis. PBI service takes this to the cloud, allows collaboration and design, and then distribute the results of the analysis to users, online.
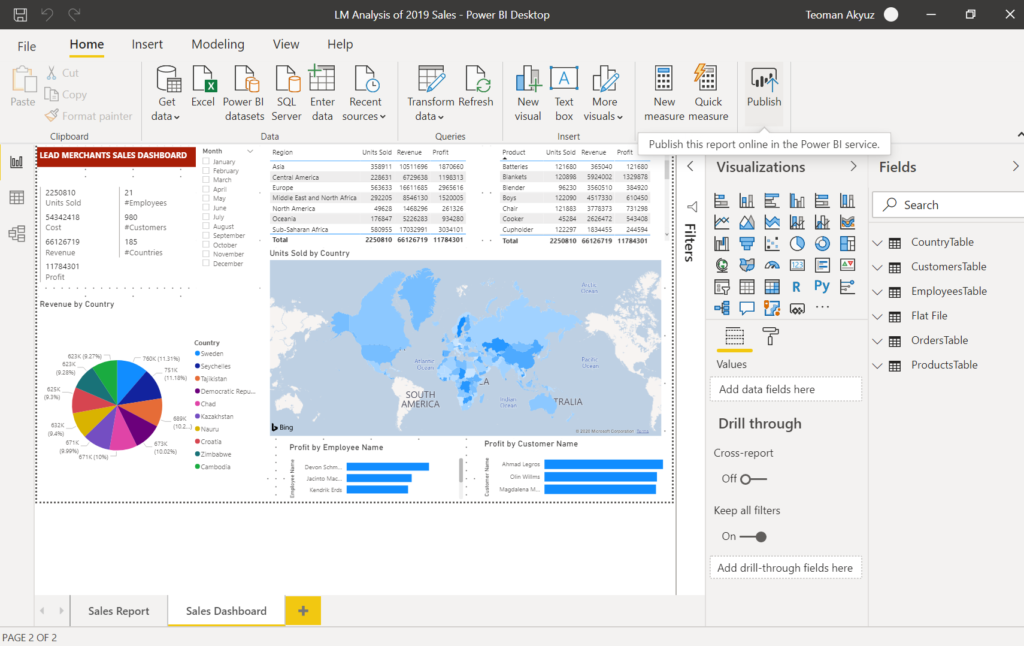
Open the LM Analysis of 2019 Sales.pbix file.
Click on the Publish button on the Home menu.
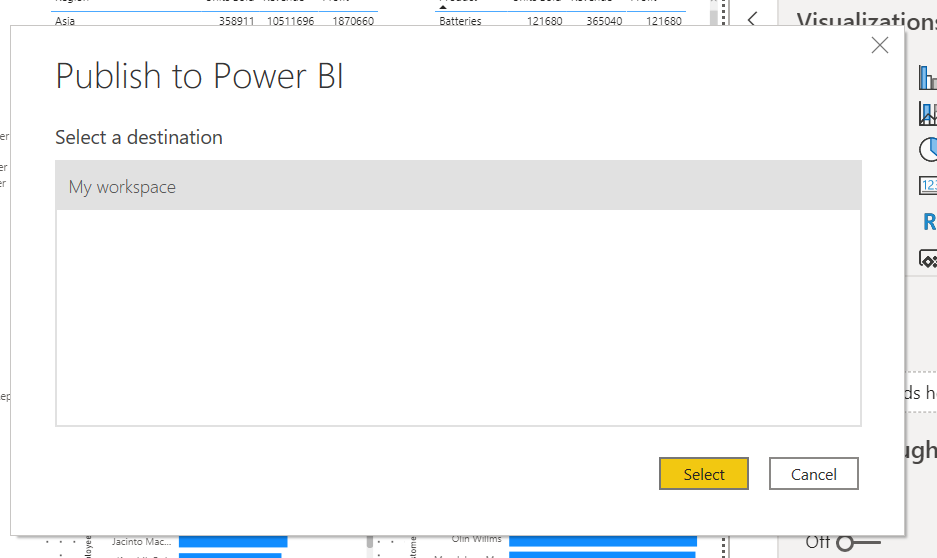
In the Publish to Power BI dialogue select My workspace.
After the Success message select ‘Open LM Analysis of 2019 Sales.pbix in Power BI’.

Power BI Service will open in a browser window, from the menu on the left select My workspace. This is where we just loaded our reports.
Power BI Service is also continuously improved with new features by Microsoft. One of the later implemented features is the new look, we will do this workshop with the new look off.
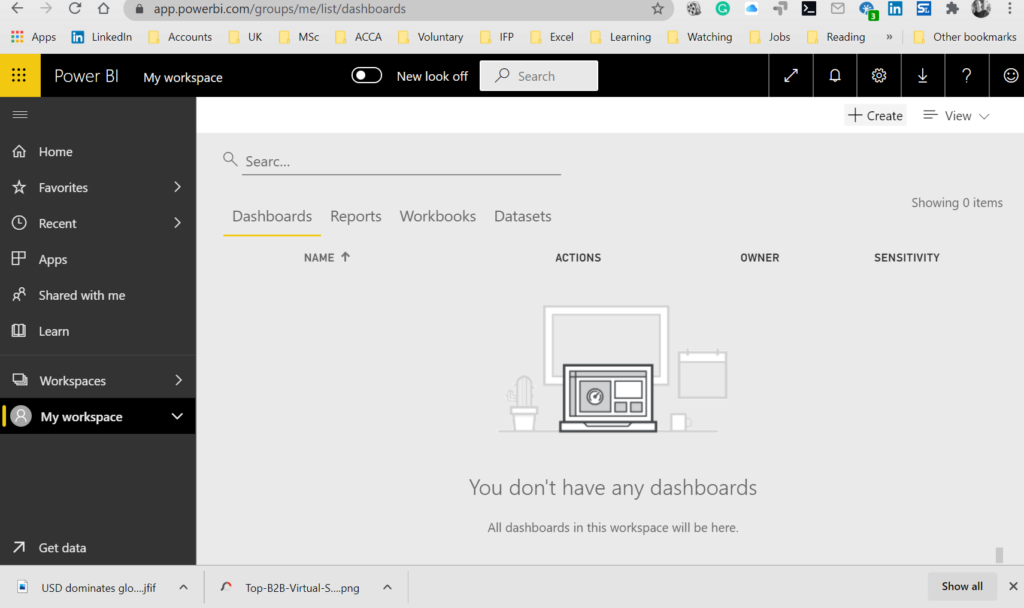
We do not have Dashboards yet, click on reports to see the 2 pages-report we have prepared in PBI Desktop.
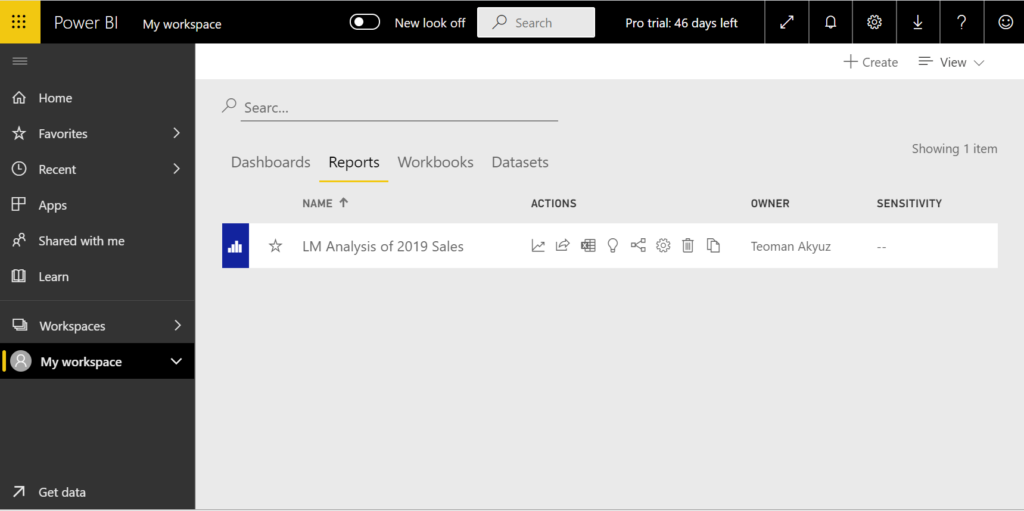
And select the LM Analysis of 2019 Sales report to examine the reports we have prepared in PBI Desktop. You can see the 2 pages we have prepared on the desktop. Select the Sales Dashboard from the page tabs at the bottom.
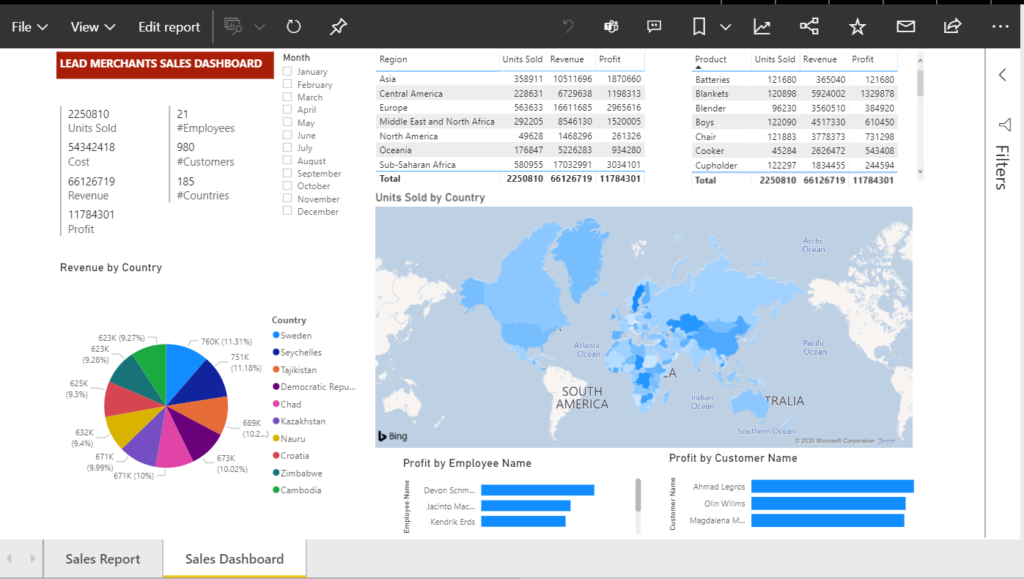
We will edit the report ‘Sales Dashboard’ and add another visualisation.
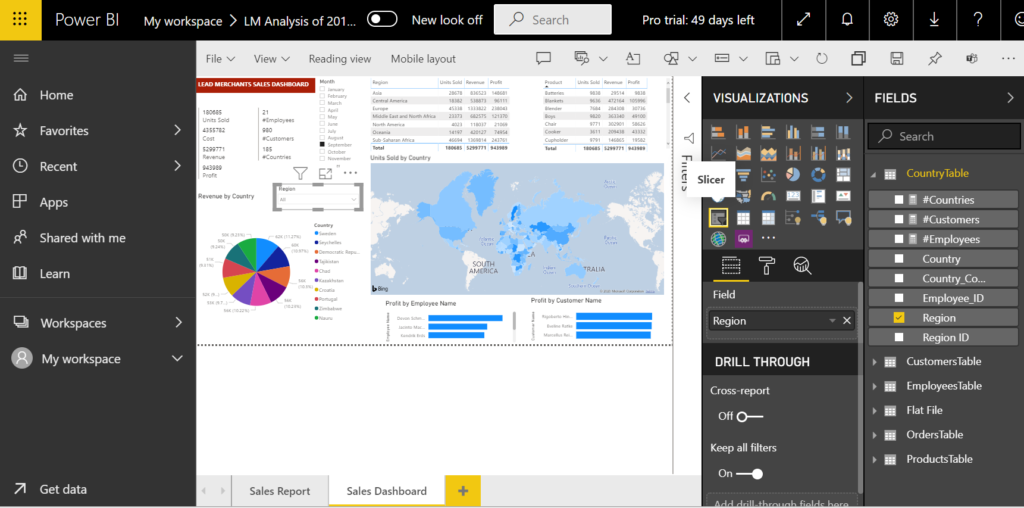
Press the Edit report button, the edit view will open.

From the VISUALIZATIONS tab, select the slicer visualisation, move and resize the empty visualisation to fit on the report. From the FIELDS Tab select CountryTable > Region. In the slicer, click on the small arrow at the top-right and choose Dropdown.
Now click on the reading view and press save in the coming dialogue.
You can play with the filters and slicers to get some insights.
Below, the Sales Dashboard report showing September 2019 results for the Oceania region.
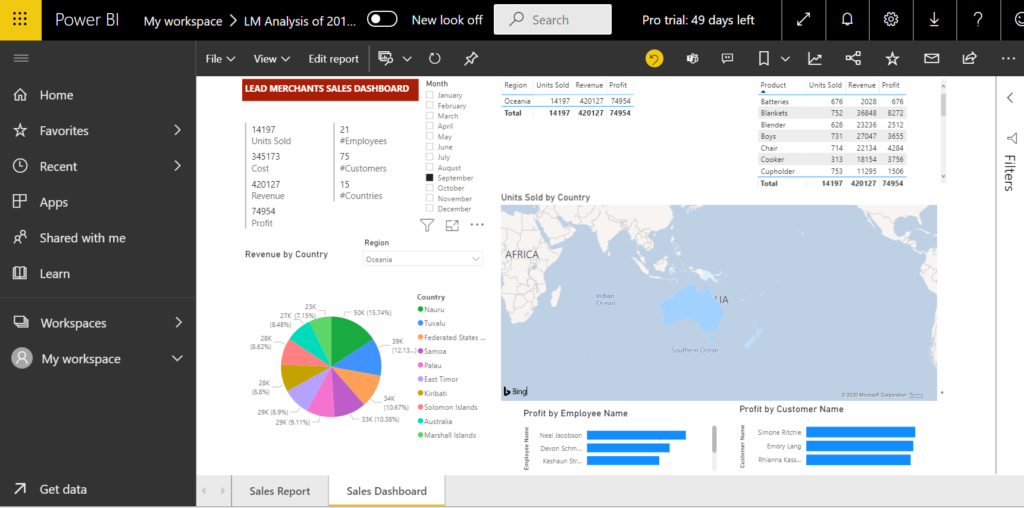
When you set the filters and reach the results you are looking for, add a bookmark before moving forward to easily come back to the same place later.

On the file menu, there are options to save, print, export as pdf or publish the report on the web. Export a pdf copy of the report page with the desired filters.
On the Sales Report page, select September and Oceania by pressing the Ctrl key.

Add another bookmark.
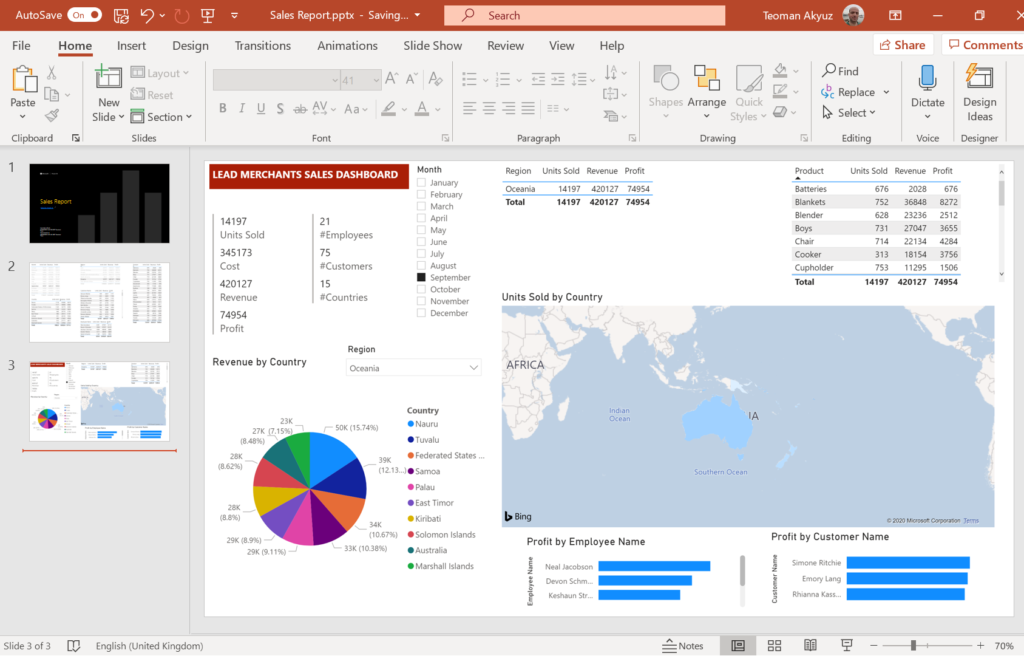
Under the file menu, you can find commands to save, print or export reports as pdf, or publish them on the web. Select Export to PowerPoint, from Export dialogue select current views.

PBS downloads the PowerPoint file to your default download folder. We now have a ready to present PowerPoint presentation with a title page and 2 slides for our 2 reports.
Now press the yellow reset button to take the reports to their initial position.

Save the report at this final state, File > Save as, Name as ‘PBS – 2019 Sales’. You will see the report we just saved under My workspace > Reports.
Next, we will see how to create Power BI Service dashboards.