The Flat File
We will prepare a Flat-File which is much smaller than the original database to use in Excel for reporting.
We will use Power Query, prepare a new table from existing tables and then copy this table to Excel.
Open Power Query from PBI home menu transform data button.
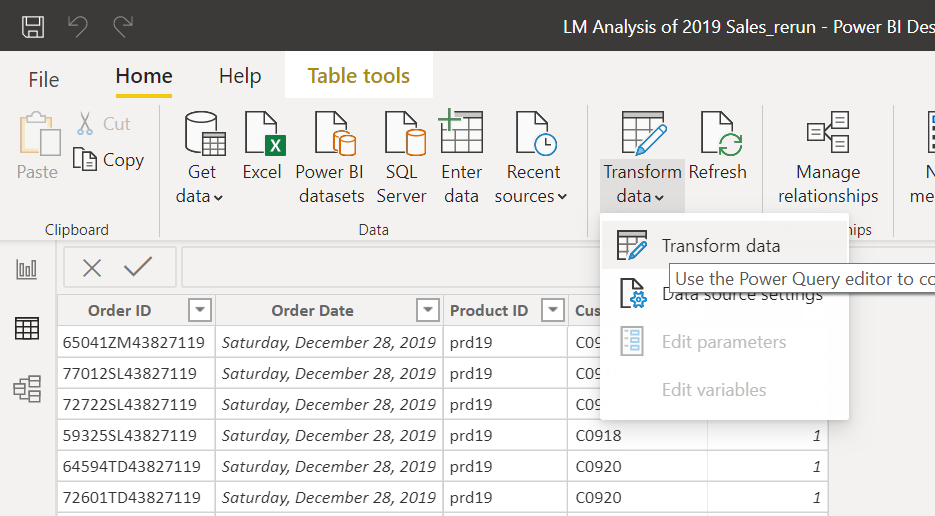
Here we will create a new table by merging columns from existing tables. We can merge 2 tables in one shot so we will have to do the merge process 4 times, to get all the necessary columns.
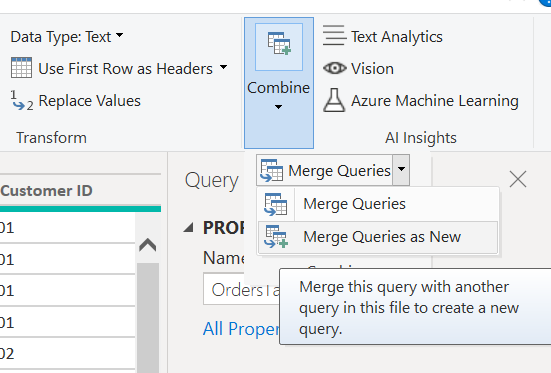
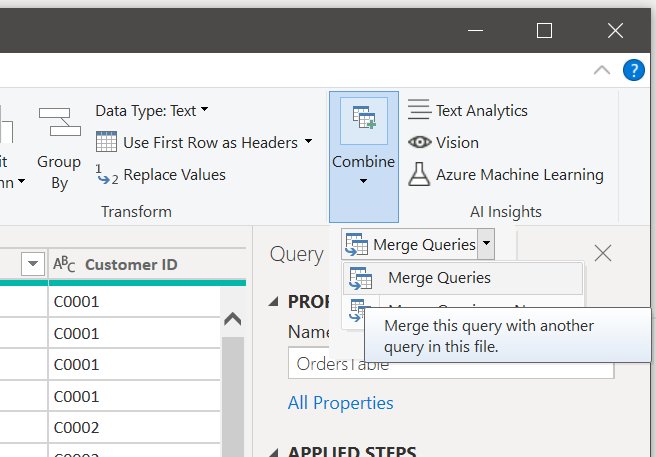
On the Home menu in PQ click Combine > Merge Queries > Merge Queries as New
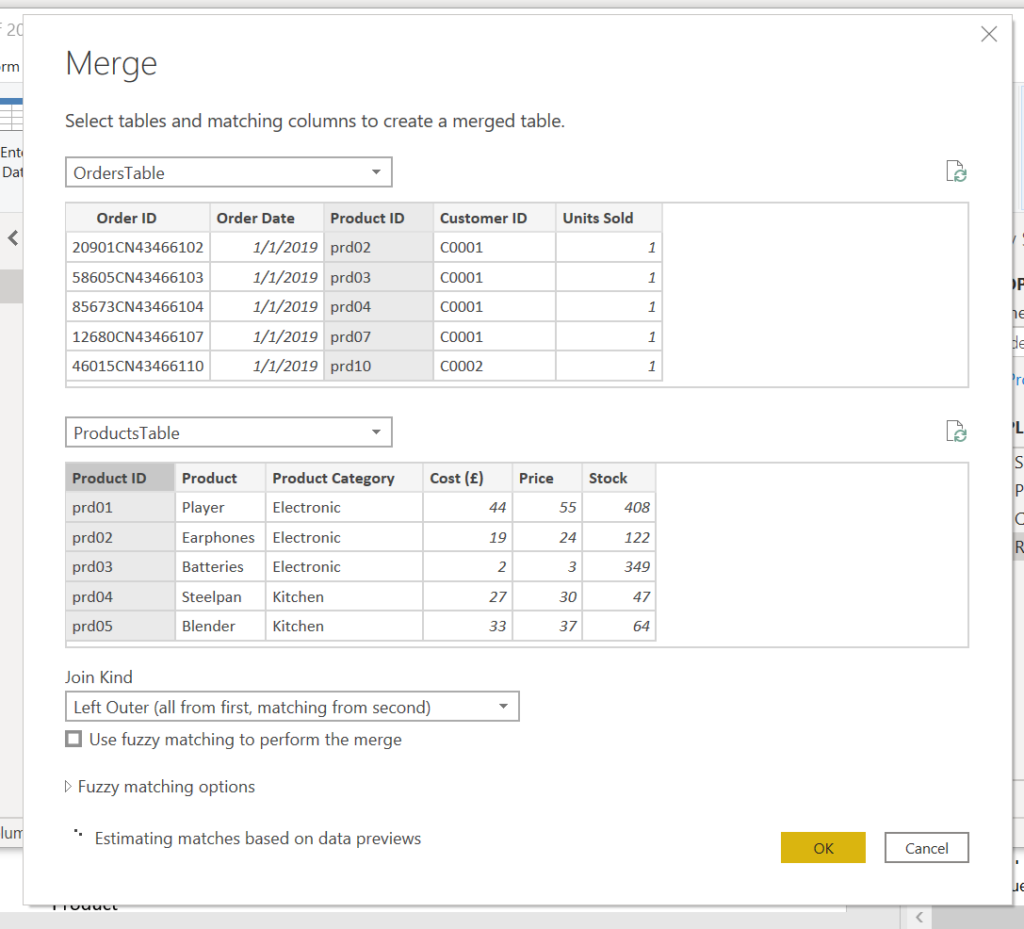
In the Merge dialogue Select Orders Table and Products Table, select Product ID columns for the link between these 2 tables and press OK.
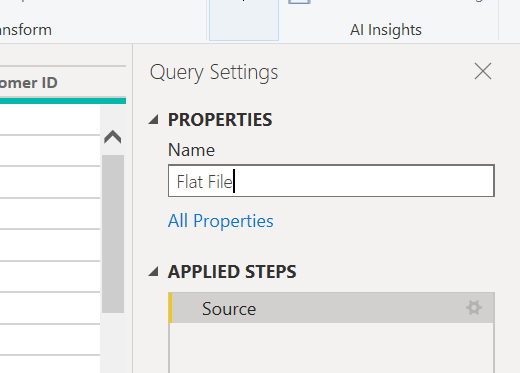
Now we have a new table named Merge1, rename under Query Settings Properties as Flat File.
We will again merge, but this time not as a new query
Combine > Merge Queries > Merge Queries
This time merge the new table Flat File with Customer table taking all columns except customer ID (this already exists in Flat File.
Do the merge for the Country and the Employee tables. You have to show connections each time and exclude already existing columns.
We have to delete the Order ID column and change the date to month.
Right-click on the Order ID column and select Remove from the drop-down list.
Then under the Transform menu select Date > Month > Month.
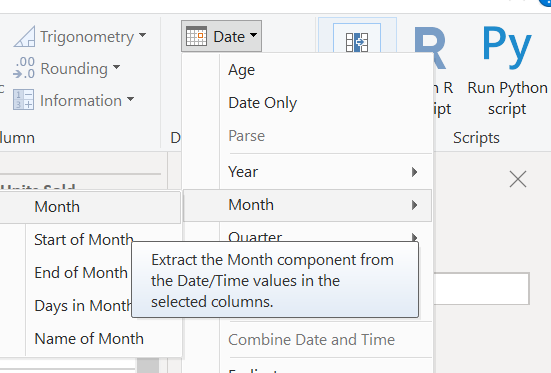
Rename the column as Month.
We have one more step; we must group the table.
Under the transform menu, press the Group By button.
Click Advanced, add all columns for grouping except Units Sold, Price and Cost columns. We will aggregate the Units Sold column and add calculated columns for revenue and cost.
Add Units Sold as a new aggregation column, select Sum operation. Press OK.
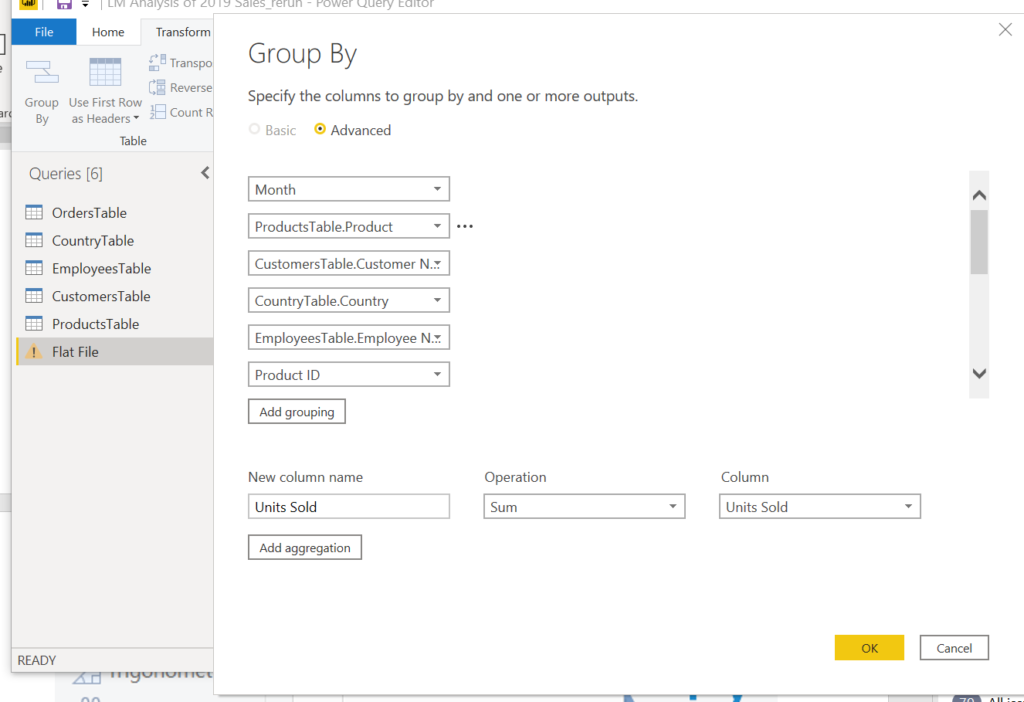
We will group the recurring rows of the table and take sum of the column with numeric values (Units Sold).
Press the Close & Apply button under the Home menu, we land in the PBI window. We have a flat-file of 229.560 rows and one header row.
We will now add the Revenue and Total Cost columns.
First, we will delete the Price and Cost columns; on the fields pane click on the three dots, select Delete on the drop-down list. Do this for both columns.
Under the Table Tools menu select New Column, at the formula bar write below formula:
RevenueF = 'Flat File'[Units Sold] * RELATED(ProductsTable[Price])
Add another column for cost:
CostF = 'Flat File'[Units Sold] * RELATED(ProductsTable[Cost (£)])
Right-click on the month column and select the Copy table.
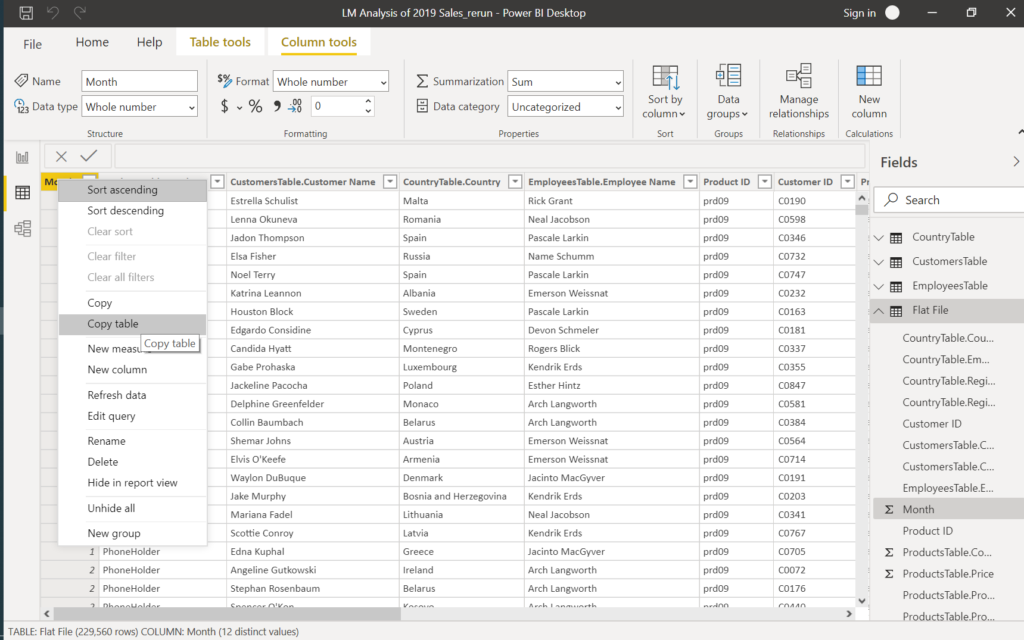
Paste the table to an empty Excel workbook to go on with the Analysis, Reporting, Visualisation with EXCEL.
Next, we will explore the Power BI service, distribute our reports online over the internet and mobile devices, have a look at the AI and connection to systems for automation.