The Report
Questions
1- What are monthly sales volumes (total units sold, revenue, profit)
2- Regional sales figures (total units sold, revenue, profit)
3- Sales by product (total units sold, revenue, profit)
4- List top 10 countries by revenue
5- Top 100 customers by profit
6- Report top 5 employees who made the highest profits
Q1- What are monthly sales volumes (total units sold, revenue, profit)
Go to the report view. You will see the blank report canvas and Filters, Visuals and Fields panes.
We will choose the visuals we want to include in our report, then add fields by checking the fields of the tables in the Fields pane and use filters to display the records we are looking for.
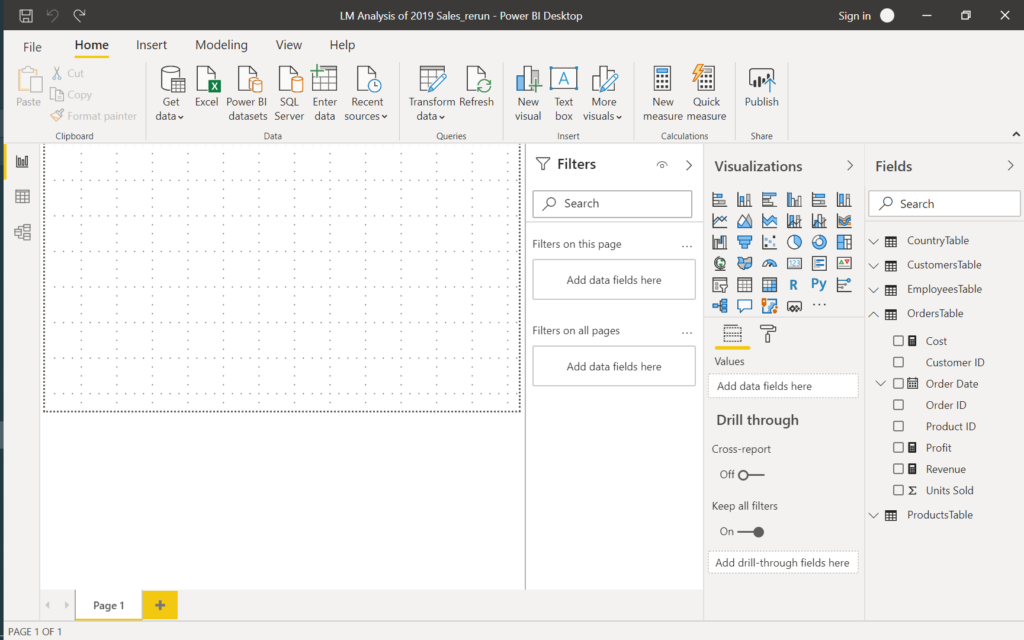
To work in a wider space on the report, click on the small arrow and collapse the Filters pane.
To answer the questions, we will only use Table visualisation, which resembles a Pivot Table.
Add Table, and a blank Table will be added to the report, then choose Month, Units Sold, Revenue and Profit fields from the orders table.
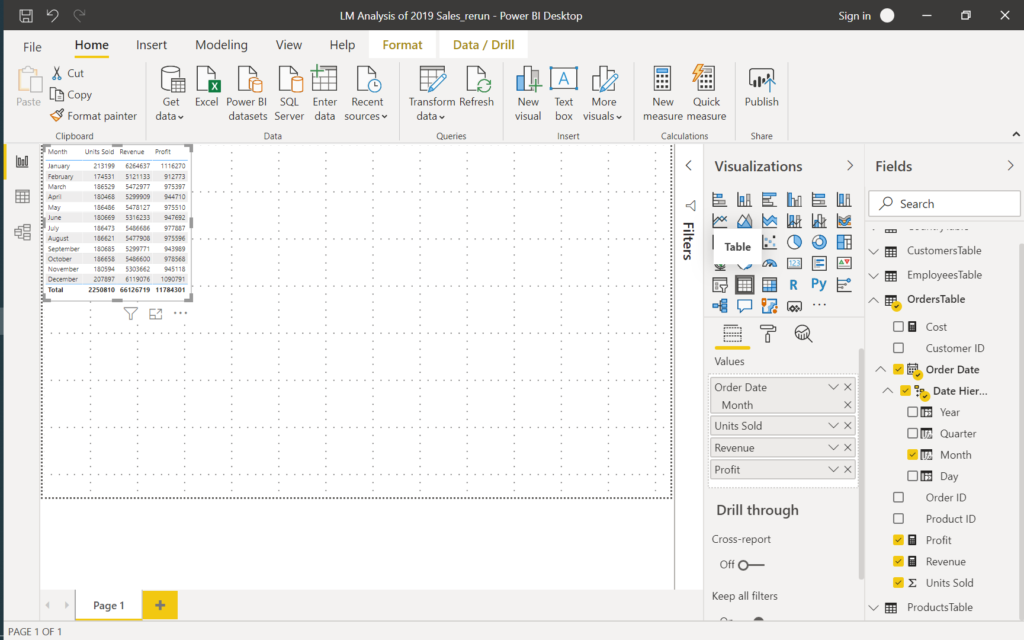
All other tables will be added with the same steps.
Q2- Regional sales figures (total units sold, revenue, profit)
Add another Table visual, select Region field from the country table, Units Sold, Revenue and Profit fields from the orders table.
Q3- Sales by product (total units sold, revenue, profit)
Add a Table, select Product field from the products table, Units Sold, Revenue and Profit fields from the orders table.
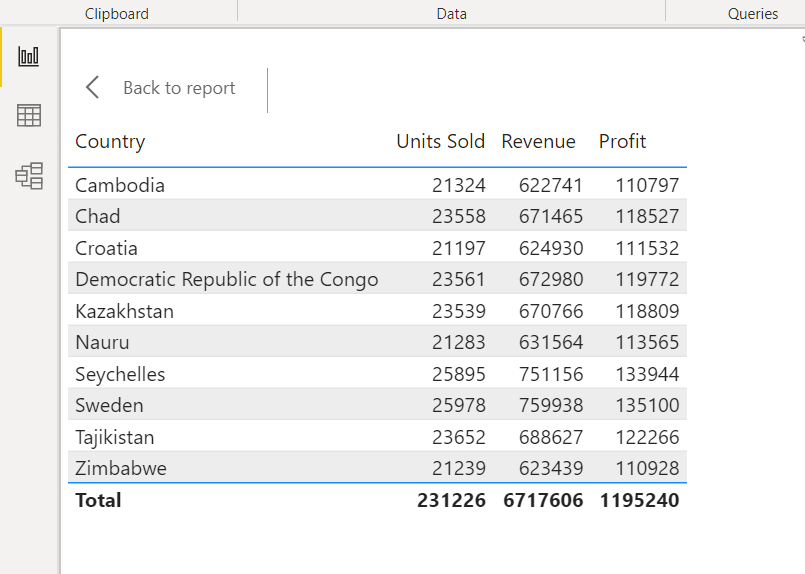
Q4- List top 10 countries by revenue
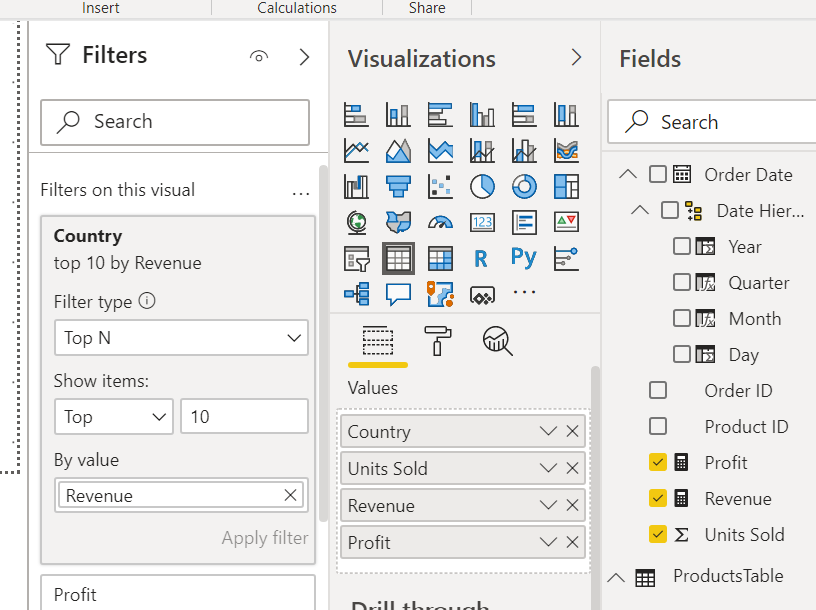
Add a Table, select Country field from the country table, Units Sold, Revenue and Profit fields from the orders table.
Now expand the Filters Pane, expand the Country Filter, select Filter Type ‘Top N’, in Show Items select ‘Top’ and write 10, drag & drop Revenu column into By value field. Press Apply filter.
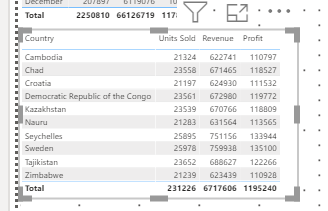
Click the Focus Mode button (one of the 2 buttons which appears when the table is selected), examine the country table.
Q5- Top 100 customers by profit
Add another Table visual, select the Customer Name field from the Customers table, Units Sold, Revenue and Profit fields from the orders table.
Add filter for top 100 customers by profit.
Q6- Report top 5 employees who made the highest profits
Add Table visual, select Employee Name field from the Employees table, Units Sold, Revenue and Profit fields from the orders table.
Add filter for the top 5 employees by profit.
After finalising all the tables make sure to resize the tables and set them on the report for best viewing, rename Page 1 (at the bottom) as ‘Sales Report’.
The tables in the report are connected and can be used as filters.
Remove the filters from Country, Customers and Employees tables and collapse all tabs on the left for best viewing. Click on September at the Months table: All the tables in the report now show September 2019 results.
All the tables are showing the September results.
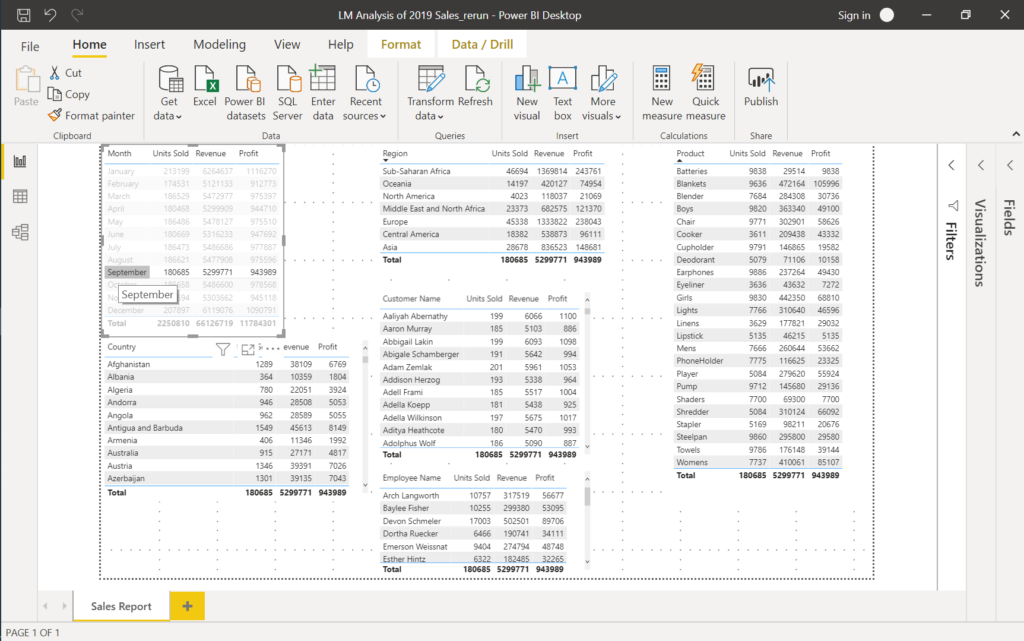
All other tables in Sales Report are filtered to show September 2019 results
The report shows the results for September 2019: Sales to all countries in all regions, sales by each product purchase by all customers, the performance of all employees for the month of September.
Recognise that the totals of all the tables are equal to totals of month September in Month table.
Let’s examine a customer’s profitability: Select Abbigail Lakin in the customers table.
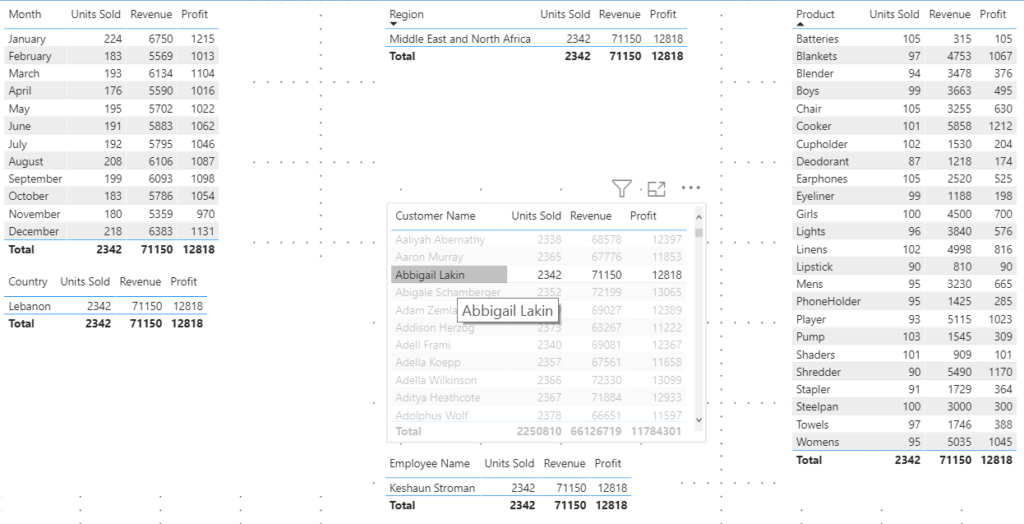
A customer belongs to one country, in one region and has one employee dealing with his/her account
The filtered tables only show the rows with data.
Abbigail Lakin is from Lebanon in the MENA region and has bought 2.342 units of products paying £71.150. Employee Keshaun Stroman is responsible for Abbigail’s account, and LM made a profit of £12.818 in 2019 from him. The monthly purchases Abbigail Lakin and the details of purchases of all products can be examined from relevant tables.
Click the Total in the Customers table the reset the filter.
And go on to prepare the Dashboard.