The Flat File
I already mentioned that the best use of Excel for me is its power on bespoke reporting. Designing spreadsheets by using formulas infinitely different ways allows preparing and automating any report, analysis, presentation you need. While Power Pivot allows you to analyse huge amounts of data in very efficient ways, the reporting and presentation capabilities are not comparable (currently) to classic Excel.
And we already argued the limitations of classic Excel. We started this workshop with SQL; we performed the analysis with SQL, but the real reason we used SQL was to summarise the data and prepare a flat-file so that we could use in classic Excel.
Power Pivot also allows us to prepare a flat file, which has not much use for Power Pivot but it is almost as good as SQL if you want your data summarised and flattened so that you can use in Excel in your old ways.
So let’s start with preparing our flat table.
In the Power Pivot Data view Home menu, PivotTable tab select Flattened PivotTable.
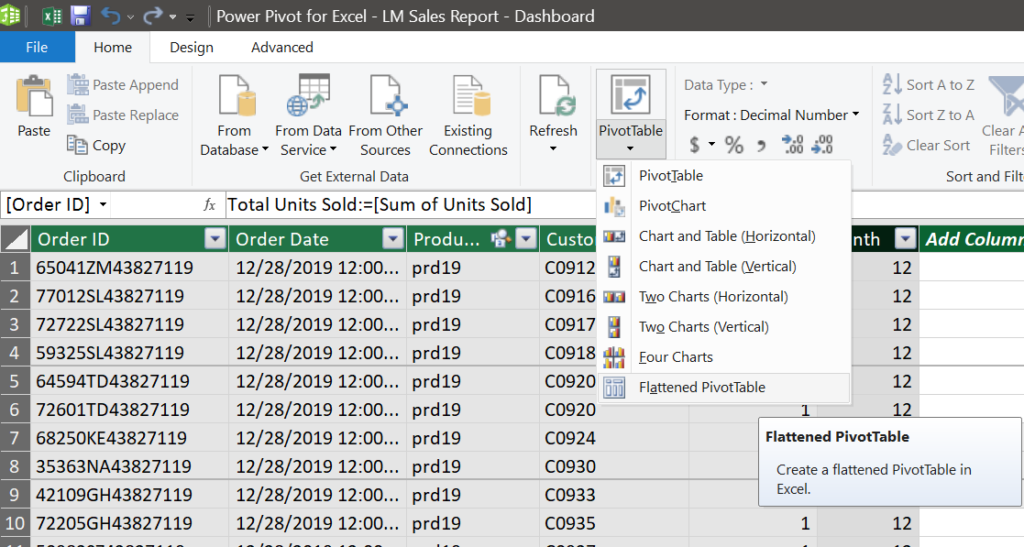
Click on the new sheet, and you will land in Excel with an empty pivot table. We will use fields from all tables for our flattened table.
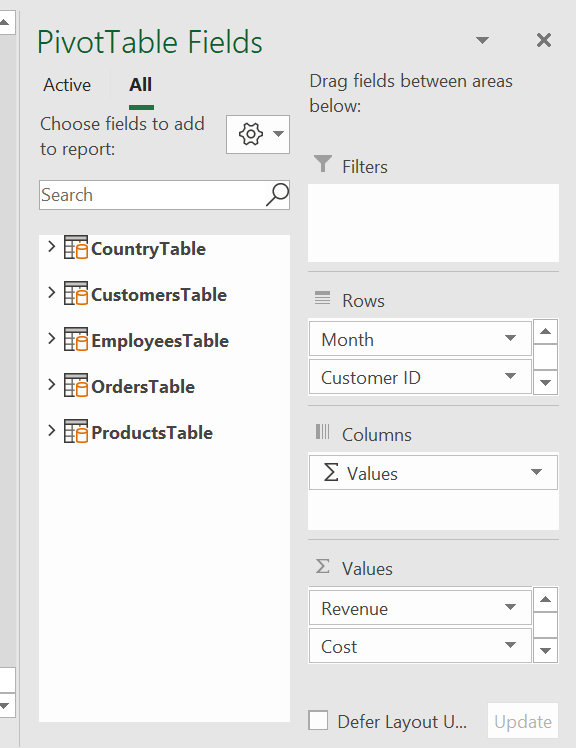
Select the columns below and put under Rows field of the pivot table (one column at a time).
You can also click near the boxes of the columns you want to add which is much easier. Beware that there is a stability issue here about Excel recognising some of the tables active and some of them (Country Table and Employees Table) inactive in the outset. The inactive tables’ columns tend to populate/branch, like normal pivot table columns, which means exponentially increasing the number of columns besides resulting in our table not being flat.
So go on and drag and drop at the given order. But do not worry about the order too much; you can change the order later by moving the columns up and down in the Rows field.
| Rows Field | |
| Table | Column |
| OrdersTable | Month |
| CustomersTable | Customer ID |
| CustomersTable | Customer Name |
| ProductsTable | Product Category |
| ProductsTable | Product ID |
| ProductsTable | Product |
| CountryTable | Country |
| CountryTable | Country ID |
| CountryTable | Region |
| CountryTable | Region ID |
| EmployeesTable | Employee ID |
| EmployeesTable | Employee Name |
| Values Field (Sum) | |
| Table | Column |
| OrdersTable | Total Units Sold |
| OrdersTable | Revenue |
| OrdersTable | Cost |
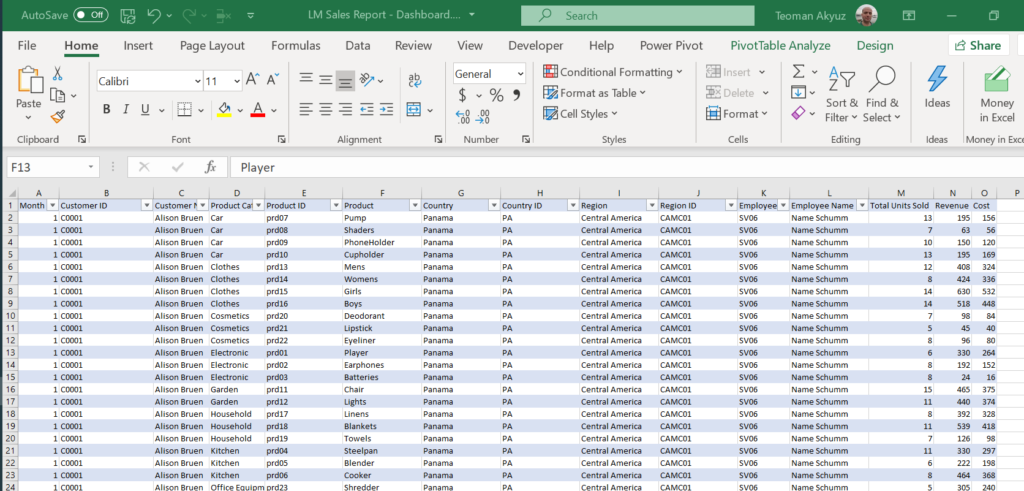
Below is an extract from our flat table ready to use to perform Analysis, Reporting, Visualisation with EXCEL. Check the file and recognise that the flat table is exactly 229.561 rows, so as the file we pulled from the same database with SQL.
Next: we will go on with Power BI, a new tool for data analysis and business intelligence.