The Dashboard
We will prepare the same dashboard as we did in Analysis with Excel. You must follow the same instructions from The Dashboard we made earlier. I will not repeat the instructions here, but I will explain minor changes to replace the formulas we used in the previous dashboard.
In the previous dashboard, the Total Sales table figures were calculated by formulas referencing to the flat table. As we are working with Power Pivot now, we do not have any data on a spreadsheet we could use to reference formulas. In Power Pivot, we can write measures, or we can create pivot tables.
Unhide the Dashboard Tables sheet to see the added Pivots to replace these formulas. As you can see, we added a pivot table taking sums of Units Sold, Cost, Revenue and Profit. And we also added 3 pivot tables for counting the Employees, Customers and Countries.
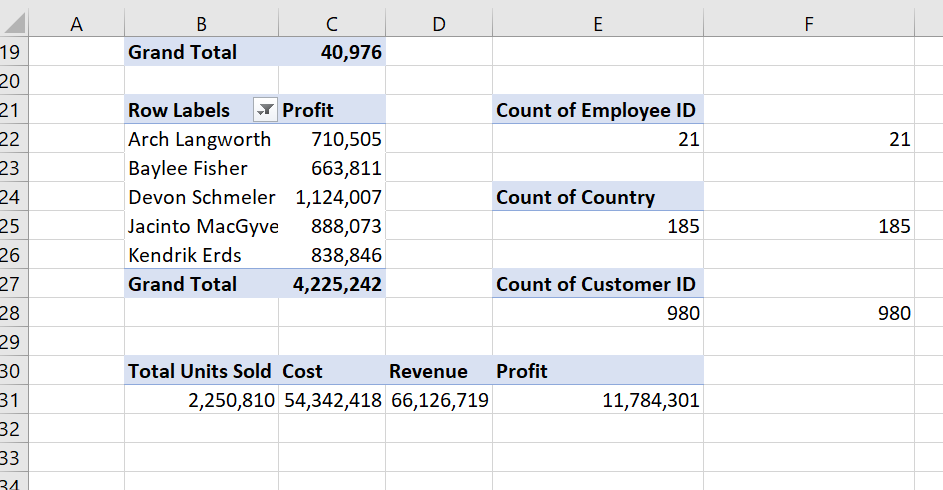
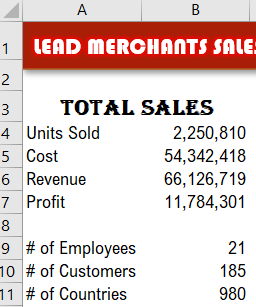
Link the results to The Dashboard Total Sales table.
These were enough for our purpose, but in case necessary, we could use a distinct count function on all tables in Power Pivot Data view.
See the DISTINCTCOUNT measure in CustomersTable.
#_of_Customers:=DISTINCTCOUNT(CustomersTable[Customer Name])